October was a damaging month for global equity markets. Not purely based off the percentage decline generated, but due to the adjustment in company valuations, interest rate rhetoric and importantly, key technical levels that were broken in the United States (US) and other leading assets. During the month of October, the S&P 500, Nasdaq and Russell 2000 declined 6.94%, 8.66% and 10.91% respectively. The German DAX and French CAC 40 were down 6.53% and 7.28% respectively and the S&P/ASX 200 was down 6.08%. Other assets that which are generally viewed as bellwether investments during times of economic growth, Copper and Crude Oil, were down 5.21% and 5.64% respectively.
Fundamental valuations
October saw leading companies in the US report their earnings. While on the surface, a large portion of these businesses beat expectations, it was their outlook and communication surrounding 2019 and beyond that was worrying. Apple (AAPL) missed shipment estimates on iPhones, offered light guidance for 2019, and announced that they will no longer report individual sales numbers for the iPhone, iPad and Mac. Amazon (AMZN) downgraded their fourth quarter revenue guidance from $73.79bn to $66.5bn – $73.79bn. Facebook (FB) missed analysts’ expectations for Monthly Active Users and told investors to expect increased expenses in 2019. Ford Motor Company (F) cited an increase in costs from the metal tariffs that will reduce their profitability by approximately $1bn over 2018 & 2019. They also saw a drop of 43% in their sales to China.
The reporting season in October has analysts expecting strong earnings growth of 20.6%; however, next year they expect earnings growth of just 9.4%. Slower growth rates require lower trading multiples. The S&P 500 is currently trading with a forward price-to-earnings (P/E) ratio of 15.6x, still well above the 10year average of 14.5x. With contracting growth rates, logically, you would expect a lower P/E multiple on the S&P 500.
Interest rates
During September, the Federal Reserve increased the targeted interest rate in the United States to 2.00% – 2.25%. Interest rates of 10-year US Treasuries reached highs of 3.227% in October. As rates continue to climb, two major things begin to happen. Firstly, the amount US corporations and US consumers must pay back on their debt gradually increases. For US corporations, this means an increase in costs, a reduction in share buy backs, a reduction in dividends and ultimately a reduction in their profit. For the US consumer, it will mean a drop in their disposable income, effectively putting a cap on discretionary spending. In turn, this will provide further headwinds to the Federal Reserve meeting their inflation target. Secondly, as rates increase, market analysts begin to use these new interest rates, when working out how they should value listed businesses. If they are using higher discount rates to value businesses, the projected growth rates of these businesses decline, leading to lower valuations (refer to Fundamental Valuations above) and ultimately, lower share prices.
Key technical levels
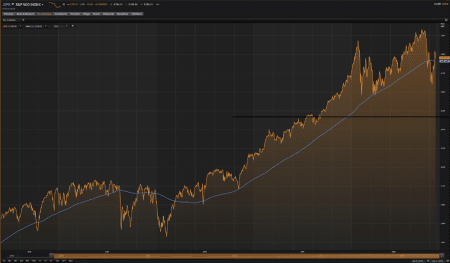
Market participants utilize the 200 period (daily) moving average (200MA) to determine if we are in a long term “bullish” or “bearish” trend. Between 11th March 2016 and until the 11th October 2018, the S&P 500 traded above this key technical level. However, during October, all US markets traded below the 200 period (daily) moving average. Having joined the rest of major global markets who are currently trading below this level, we can now expect an increase in daily trading volatility. Analysing the daily trading range (trading volatility) when the S&P500 is trading above or below the 200 period (daily) moving average over the last 10 years is telling. When the S&P500 is trading above the 200MA, the daily trading range is 1.101%. When trading below the 200MA, the average daily trading range is 1.982%, reflecting a ~80% increase in daily volatility.
In summary, October was a revealing month for global equity markets, and one that does support our view that the global equity bull market has become tired. Given that the experiments of Quantitative easing and Quantitative tightening are occurring both simultaneously for the first time, incorporating positions in a portfolio to capture two-way volatility must be considered.