Weekly Update | January 12, 2024
If you would like to watch this update rather than read it, please click the video below!
Let’s hop straight into five of the biggest developments this week.
1. Switzerland CPI stagnant at 0.0% m/m
Inflation in Switzerland rose faster than expected in December. The CPI data came in at 0.0%, a rise from the previous deflationary figure of – 0.2%. This narrowly exceeded market expectations of – 0.1%, indicating that inflationary pressure is on the resurgence. Rebounding energy prices largely underpin the rise in inflation.
2. Japan’s Tokyo core CPI fell to 2.1% y/y
Inflation in the Japanese capital Tokyo fell to the lowest level since July 2022. The annual CPI report came in at 2.1% in the year to December, cooling markedly from the previous 2.3% as was expected by market forecasts. This came as a reprieve to the BOJ that has been under immense pressure to move on from its overly loose monetary policy and raise rates in light of relentless inflation over the last few months.
3. Australia’s CPI slumped to 4.3% y/y
Inflation in Australia thawed at a faster rate than initial estimates in the twelve months to November. The annual CPI report came in at 4.3% from the previous 4.9%, marking the lowest headline inflation reading since January 2022. This was below the 4.4% priced in by markets, pointing to the great extent to which the aggressive monetary policy tightening is easing inflationary pressure.
4. US CPI rose to 3.4% y/y
Inflationary pressure is resurging at a faster rate than expected in the US. The CPI figure rose to 3.4% in the year to December, marking the highest reading in three months. This was significantly higher than the previous reading of 3.1%, as well as the 3.2% expected by market participants. With housing and energy prices leading price elevation metrics, economic commentators are pushed to review their rate cut expectations for 2024.
5. US unemployment claims receded to 202K
The US labour market continued to demonstrate resilience as the festive season came to an end. The seasonally adjusted employment claims fell to 202K from the previous upward revision of 204K, a better showing than the gloomy market prediction of a rise to 209K. It remains to be seen whether these are merely seasonally driven improvements or the recently turbulent US labour market is rebounding.
As per usual, below shows the performance of a range of futures markets we track. Some of these are included within the universe of our multi-strategy hedge fund.
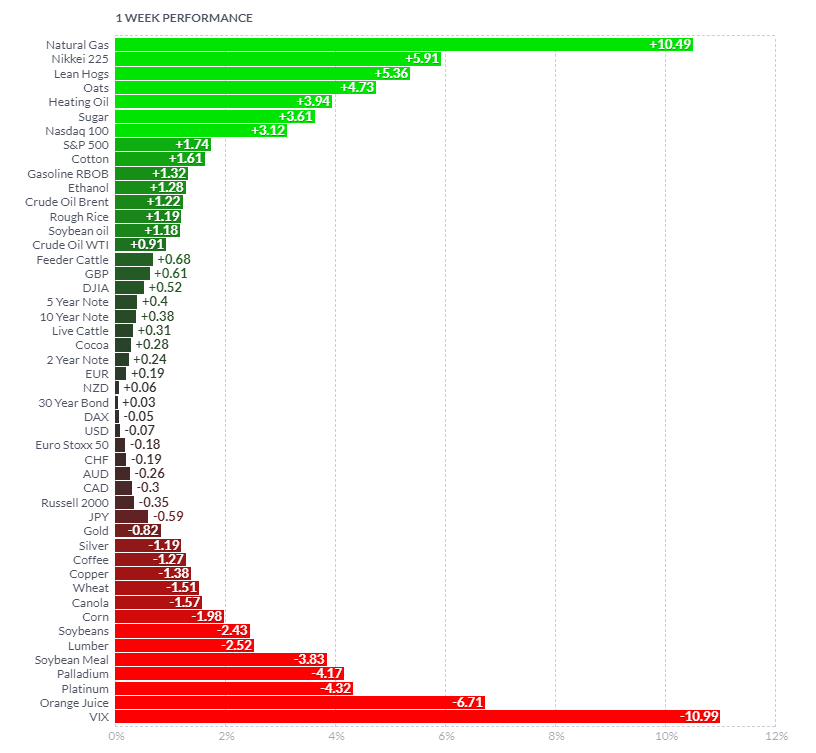
The VIX fell sharply as markets revised geopolitical risk of escalation lower. Equity indices were generally mixed, the Nikkei up +5.91% on positive inflation data while Russell was down -0.35%. The energy complex remained elevated on further supply chain concerns after Iran seized a tanker off the coast of Yemen in the Red Sea. Orange juice was down on demand shortfall as festive demand waned, while metals and lumber fell out of favour as construction volume declined over the festive season.
Here is the week’s heatmap for the largest companies in the ASX.
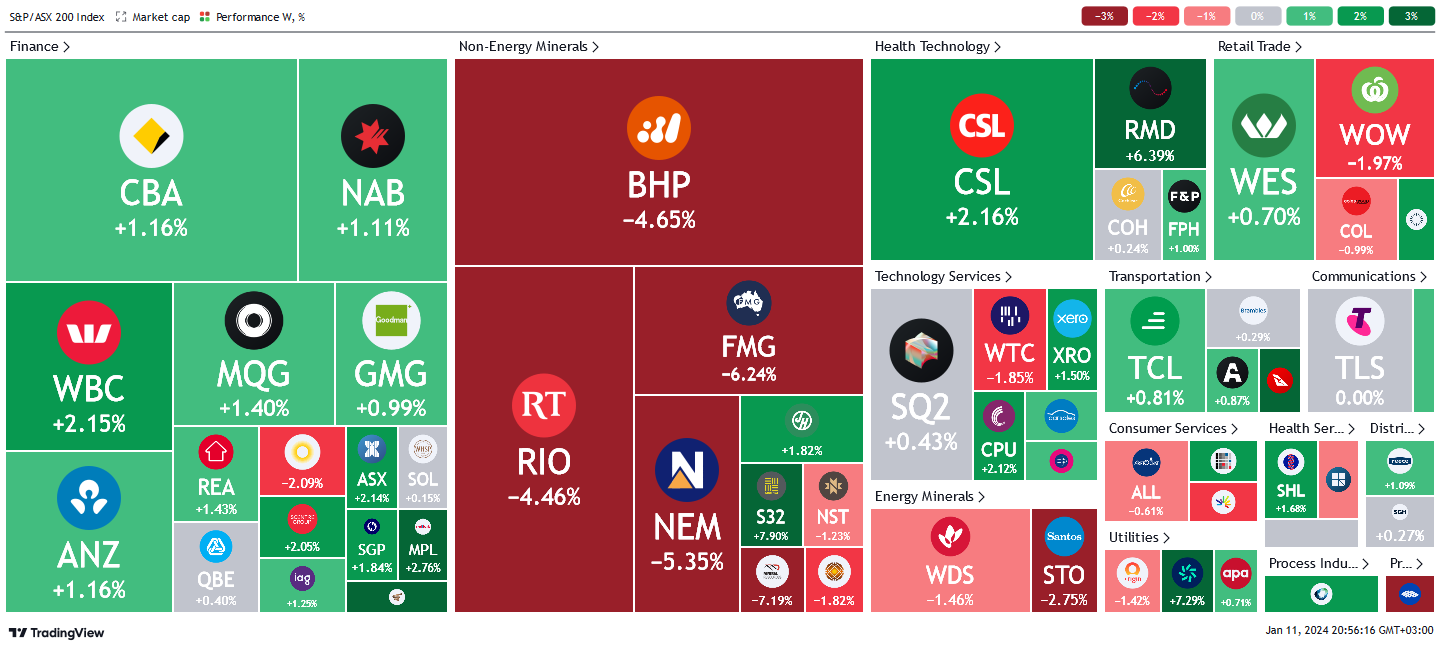
An overall mixed week for the ASX with bias to the upside. The financial sector performed well, as it was encouraged by a fall in inflation data, which reduced prospects of a further rate hike. All stocks were in the green with the exception of SUN which sold off – 2.09%. MPL and ASX led the sector higher with gains of +2.76% and +2.14% respectively. Non-energy miners were a big let off this week with most stocks trailing as the festive demand fizzled and markets took profit after recent stellar runs. MIN and FMG outsold the index to close – 7.19% and – 6.24%. S32 and JHX being the only islands of green in a sea of red for the sector, closing up +7.90% and +1.82% respectively. Healthcare tech, transporters and retailers were bullish across board, while energy miners and constructors were largely down.
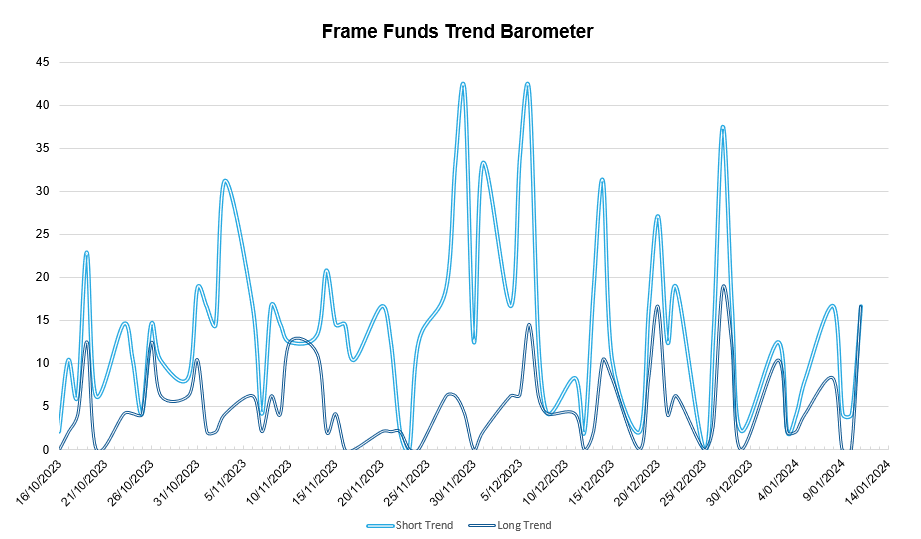
Below shows our proprietary trend following barometer which captures the number of futures contracts within our universe hitting new short and long-term trends.
Please reach out if you’d like to find out more about how our quantitative approach captures the price action covered above, or if you would like to receive these updates directly to your inbox, please email admin@framefunds.com.au.